Operationalizing NPS: Building a Strategic Listening Engine
How I redesigned the Voice of Customer (VoC) program to diagnose a critical sentiment drop (NPS 3) and guide the recovery roadmap.
Project Overview
Role
Senior UX Researcher
Scale
N=2,874 Respondents
Methodology
Sequential Mixed-Methods
Outcome
Lifted NPS from 3 to 7
Business Context
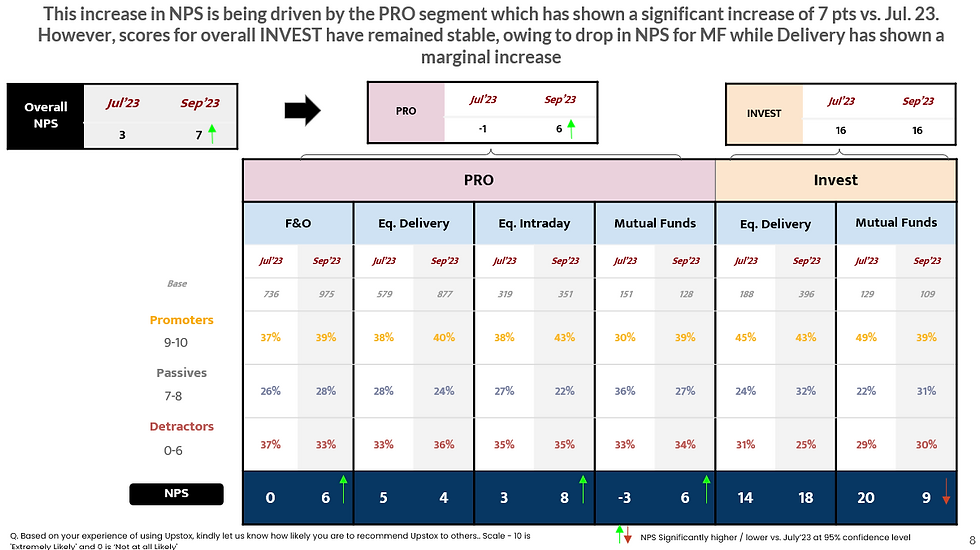
In July 2023, Net Promoter Score (NPS) fell to 3, signaling critically low customer advocacy among active traders. While user acquisition remained strong, sentiment among engaged users had weakened creating a disconnect between growth metrics and customer loyalty.
The September wave showed recovery (NPS rising to 7), but the movement was uneven across segments. High-frequency “PRO” traders showed improvement, while certain investor cohorts remained vulnerable due to pricing perception and customer support dissatisfaction.
For a brokerage platform operating in a highly competitive, price-sensitive market, NPS volatility is an early indicator of churn risk particularly among revenue-driving segments such as F&O and intraday traders.
The business needed to determine:
-
Whether dissatisfaction was driven by market conditions or product performance
-
Which segments were at highest retention risk
-
Which operational levers (pricing, stability, support) required immediate intervention
This study aimed to transform NPS from a passive reporting metric into a segmented diagnostic system that could guide roadmap and retention strategy.
The Challenge: Moving Beyond "Vanity Metrics"
In Q2 2023, Upstox’s NPS dropped significanIn July 2023, our NPS hit a critical low of 3. The business treated NPS as a simple "Scorecard." My goal was to transform it into a Diagnostic Tool. The challenge wasn't just to "raise the score," but to understand why sentiment had decoupled from user acquisitiontly from 57 (Best-in-Class) to 48 (Warning Zone). While the product team celebrated the high volume of new users, the sentiment data told a different story. My objective was to peel back the "Score" and understand the drivers of this dissatisfaction before it turned into churn.
My Process: The "Signal vs. Noise" Framework
To ensure the data was actionable, I moved away from generic "blast" surveys. I designed a Sequential Mixed-Methods approach to isolate operational friction from market sentiment.
-
Step 1: Strategic Sampling & Segmentation
To ensure relevance, I restricted the sample to recently active traders.
-
The Criteria: I strictly targeted Active Traders (at least one order in the last 6 months) to ensure feedback was based on recent product experiences.
-
The Segments: I stratified the sample into 7 distinct cohorts (e.g., F&O Pro, Equity Intraday, Mutual Fund Investors) because a "Scalper" has radically different needs than a "Passive Investor".
-
Step 2: The "Driver-Based" Survey Design
Instead of a simple open text box ("Why did you rate us?"), I structured the quantitative survey to force users to categorize their pain.
-
The Taxonomy: I created specific buckets: Pricing, App Performance, Order Execution, and Support.
-
The Why: This allowed us to immediately quantify that 28% of detractors were specifically facing "Lags/Slowness," moving the conversation from "Users are unhappy" to "The app is slow".
-
Step 3: Qualitative Validation (The Deep Dive)
Quantitative data tells you what is wrong; Qualitative tells you where to fix it.
-
The Action: I conducted follow-up telephonic interviews with "High-Value Detractors" (F&O Pros).
-
The Finding: The "Lag" wasn't random. It was happening specifically at 9:15 AM (Market Open). This specific detail—uncoverable by survey alone—allowed engineering to pinpoint the exact server load issue.
The Analysis: Separating Price vs. Product
Analysis revealed a "Tale of Two Cities":
-
The "Business" Problem (Pricing): 38% of detractors were angry about "High Brokerage" because competitors offered Zero Fees. This wasn't a UX issue; it was a business model issue.
-
My Action: I flagged this to the Strategy Team to explore Subscription Models.
-
-
The "Experience" Problem (Stability): For the critical "F&O Pro" segment, Speed was the #1 Detractor. 28% cited "Slow Performance" as their dealbreaker.
-
My Action: I flagged this as a P0 Roadmap item: "Fix Morning Latency."
-
Rigorous segmentation allowed us to diagnose that "Pro" traders were suffering from tech lag, while "Investors" were price-sensitive.
The Impact: Closing the Loop
By operationalizing the feedback loop, we moved from "Passive Listening" to "Active Fixing."
-
The Score: In just two months (July–Sept),Contributed to NPS recovery from 3 to 7 through targeted stability and segmentation insights..
-
The Segment Win: The most critical segment, F&O Pros, saw their sentiment lift from 0 to 6, proving that our focus on "Platform Stability" directly impacted our most valuable users.
Reflection
This reinforced that NPS is an operational diagnostic tool, not just a brand metric., it is an operational one. By rigorously segmenting the data, I was able to protect the product team from 'noise' (market losses) and focus them entirely on 'signal' (latency and pricing friction)